


This paper is a result of a cyber risk assessment undertaken with the goal of increasing the cyber awareness of operators of infrastructure, managers, and political leadership. The meaning of cyber has, in our opinion, been aggregated to a bumper sticker label so generic, it means very little of anything to anyone trying to understand cyber risk. Senior executives and political leaders have a very limited understanding of industrial control systems (ICS) and the crucial role ICS provide to public/private infrastructure, industry, and military systems. Therefore, to accomplish our
purpose, we conducted a cyber-risk study focusing on a bridge tunnel ICS – a scenario of concern. In this paper we present the analytic approach, discuss our model, simulation, and analyze the results using a notational data and generic system description. As a result of this study we were able to discuss the importance of controls systems with senior leaders. We were able to demystify what we mean by “cyber” showing that it is possible through simulation to inject the effects of cyber scenarios of concern into simulations to assess impact. There was also an unintended benefit: During a system audit, ICS operators with decades of engineering experiences began to realize that the ICS is vulnerable to willful intrusion. More of these studies are needed to raise awareness.
Introduction
The rapid growth of information technology and increased interconnectivity has led to increased efficiency and functionality for transportation infrastructure. However, it has also significantly increased the risk to the cyber systems essential to the safe and continuous operation of the Commonwealth’s transportation infrastructure. There is increasing concern among both government officials and industry experts regarding the potential for a cyber-attack on a national critical infrastructure via industrial control systems. Experts believe that ICS are more vulnerable today than in the past due to the increased standardization of technologies, the increased connectivity of ICS to other computer networks and the Internet, insecure connections, and the widespread availability of technical information about control systems (Wilshusen, 2012). Reported attacks and unintentional incidents involving control systems demonstrate that a serious attack could be devastating (Weiss, 2010).
ICSs are used to monitor, operate, and control major industrial systems including power production, power transmission and distribution, water and wastewater control, and transportation systems such as the bridge tunnel systems (Boyer, 1999). These systems are connected through a communications network that can include physical cable connection, radio signals, microwave, satellites, or connection through the Internet over LAN and WAN. As ICSs have evolved, they have increasingly embraced open forms of communication and are therefore vulnerable to many of the same threats as any typical corporate TCP/IP based communication system. In a typical ICS, there is very little authentication of the origin of the signals. A properly encoded transmission is usually accepted by the supervisor station and remote units without verification. If an attacker were able to access the ICS communications network for instance, they would be able to send deceptive signals to disrupt normal transportation operations by overriding fail-safes in systems and cause severe infrastructure disruption and extensive downtime (Weiss, 2007).
Consequences of disruption of these critical infrastructures is not constrained to owners and operators, but can have a substantial impact on the rest of the community. Disruption of power, contamination of water supplies, and the breakdown of a transportation network can all have far reaching economic, social, and even human impacts to the entire region by disrupting businesses, creating widespread unrest, and creating illnesses and injuries. To date, there have been four control systems cyber incidents in the US that resulted in fatalities, three major cyber-related electric outages, and two nuclear plants shutdown from full power. Cyber incidents have impacted water, electric, manufacturing, transportation, and pipelines.
To address a situation described above we conducted a risk assessment. Risk assessment answers three questions: what can go wrong; what is the likelihood; what are the consequences (Kaplan and Garrick, 1981)? In this paper, we define risk as potential for an unwanted outcome resulting from an incident, event, or occurrence, as determined by its likelihood and the associated consequences (DHS Risk Lexicon, 2010). Conceptually, we model risk as the triplet of threat, vulnerability, and consequence. Mathematically, we calculate risk by multiplying the probability of an attack P(A), the probability of success, given an attack P(S|A), and the associate consequences, C. Equation (1), then, is a common expression of homeland security risk (Ezell et al., 2010).
Risk=P(A)×P(S|A)×C (1)
This probabilistic relationship has been used by DHS since 2005 and has been shown to be a useful first-order indicator of terrorism risk as the expected consequences (loss of lives, economic losses, psychological impacts, etc.) against which the benefit of existing or potential terrorism strategies, policies, and countermeasures can be evaluated and estimated (Ezell et al., 2010). However, Parnell et al. (2008) and others have been critical of the model in dealing with an intelligent adaptive adversary. In this probabilistic framework, the attack probabilities P(A) in Equation (1) are for the most part agreed to be the most challenging to estimate. Quantifying P(A) requires knowledge, data, or modeling about the motivations, intent, and capabilities of terrorists (largely the domain of the intelligence community), in addition to — or instead of –knowledge about historical attacks and their relevance to current risk. Our analytic approach detailed in the next
section addresses adversary behavior by including system audit and red team assessment to design an intelligent attack vector as one would expect a serious adversary to do.
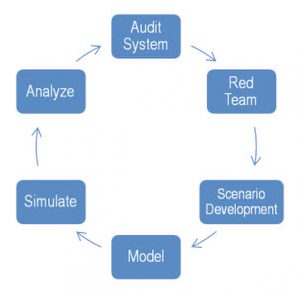
Figure 1. ICS Risk Analytic Methodology
Analytic Approach
Figure 1 depicts the six step analytic methodology we employed. The process began in step one Audit System, when we met with a transportation planning organization to assess the regional impact of cyber-attack on a tunnel system that resulted in a complete and extended (at least eight hours) closing. To accomplish this, we conducted site visits to the tunnel system to interview key stakeholders and learn about the ICS, workforce, and the physical tunnel system (step two). As a result of these visits, we concluded that for the tunnel system, a Stuxnet-styled attack through the ICS USB thumb drives was a scenario of common concern (step three). In step four we developed a model to estimate the likelihood of the scenario and the system consequences. Following this, we injected the effects of the cyber-attack into the transportation model to simulate the regional impact (step 5) and analyzed the results (step 6).
Stuxnet Cyber-Attack on a Tunnel’s ICS
In this section we describe the scenario narrative. Second, we discuss the event tree model to estimate the likelihood of attack, followed by the transportation model to assess the regional impact. The final section concludes with a summary of the risk. For the tunnel scenario we chose to use a Stuxnet-style of attack that would be installed on the system unknowingly by one of the ICS operators through a USB file transfer. The motivation and intent behind the operator’s actions are not part of the scenario. Obtaining the virus could occur in many places, i.e. conferences, tradeshows. It is however, an action that is similar to those of a disgruntled employee, trusted insider, or one bribed by an external threat. It is also important to note that because of the nature of the analysis, all of the data is notional and the details of the model are generic.
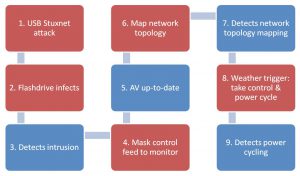
Figure 2 Incident Chain to Assess Scenario Likelihood
Notional ICS Description
The Tunnel ICS is an off-network system, meaning the ICS is not connected to the Internet or a part of the office LAN. All the program logic controllers (PLC) are hardwired to the system and at no point is the system connected to the Internet. Program changes and updates are pushed through using USB transfer from control system engineer to the SCADA system.
Red team attack vector and plausible scenario was described in the following way. A control system engineer doing scheduled maintenance on the control system placed all the upgrade files and program changes on his USB device that he uses for all of his daily work. A virus from his computer made its way to the USB device he was using. Because no malware checks were conducted on the USB drive prior to mounting it to the control system servers, the malware made its way to the ICS system without detection.
Once the virus was on the system it went live, going throughout the control system network, corrupting program files, changing file types and causing disruptions on the HMI user screen. After several weeks no major disruptions occurred and the virus was still undetected. The virus was designed to wait until sensors logged a heavy rain day and at that time, the virus would activate and cycle equipment off and on. Using a Confiker, the virus would mask the operator’s monitor from the actual logged data. Based on recent similar attacks, forensics after the attack and damage would occur weeks later.
Estimating the Likelihood of Attack
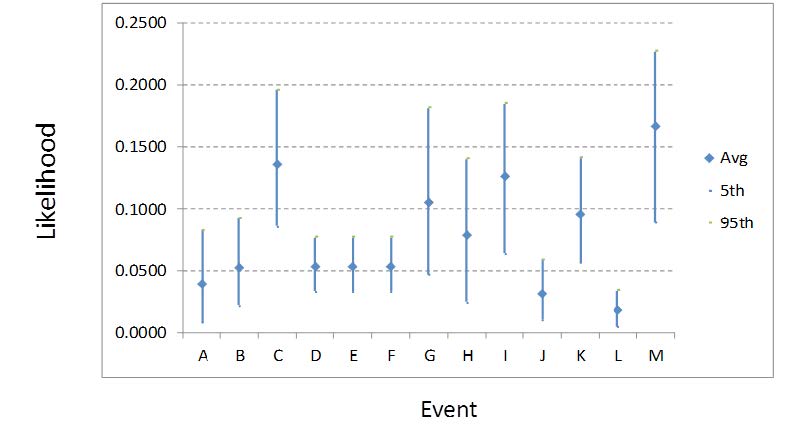
Figure 3. Events A-M: Tunnel Damage to Equipment vs. Likelihood Estimates
To model the attack, we developed an event tree using the incident chain shown in Figure 2. Each event (or node) is color coded red to indicate attack steps, or blue to indicate tunnel system actions. At each node in the tree, there was two-way branch split for yes/no or success/failure pairings. Event trees inductively model the sequences of events that lead to consequences. Event trees models work by assigning probabilities to branches to represent the likelihood for the correct value for each branch. Probabilities are assessed conditionally on the assumption that all the branches leading to that node represent the true state of the preceding parameters. Because they are conditional probabilities for an assumed mutually exclusive and collectively exhaustive set of values, the sum of the conditional probabilities at each node is one1.
Mr. Joe Weiss, the project team’s cyber consultant, provided probability estimates for each step2. For the probability estimate, we elicited a minimum, most likely, and max value to account for uncertainty. Using Oracle’s Crystal Ball simulation software, we simulated the attack in the event tree. For the simulation, we assumed the Stuxnet style attack wasinitiated. The results of the simulation indicate that six paths through the event tree resulted in tunnel damage to pumps and fans as shown in Table 1. Figure 3 shows the uncertainty associated with likelihood estimates for each probability path (event) in the tree. For instance, Event C is the most likely event leading to tunnel damage.
1 For more information on event tree modeling, see Ezell et al. Probabilistic Risk Analysis and Terrorism Risk, Risk Analysis, Vol. 30, No. 4, 2010 (http://www.dhs.gov/xlibrary/assets/rma-risk-assessment-technical-publication.pdf)
2 Joseph Weiss is an industry expert on control systems and electronic security of control systems, with more than 35 years of experience in the energy industry. He has conducted numerous SCADA system vulnerability assessments, taught numerous SCADA security short courses, given several university lectures, and authored the book- Protecting Industrial Control Systems from Electronic Threats.
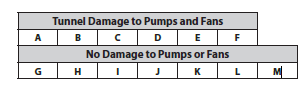
Table 1. Event Probabilities for Paths in the Event Tree Model
Consequences: Regional Impact of Tunnel Closure
The notional tunnel complex (Tunnel A) in this scenario is 5 miles long and enables vehicles using a highway system to traverse through the region. It serves as the major crossing between the northern and southern sectors of a major metropolitan area. A second tunnel complex (Tunnel B) serves a similar function located on the western side of the region between the north and south side.
The northern sector was simulated as having a population of approximately 400,000 and the southern sector a population of approximately 800,000. In addition to its higher population, the south side has a high proportion of the region’s employment. The composition of the region’s economy results in significant weekday peak period traffic flows from north to south in the morning and from south to north in the evening. Approximately 200,000 vehicles cross Tunnel A and Tunnel B daily in the region with Tunnel A serving a higher proportion. Daily traffic volumes across the Tunnel A exceed 90,000 vehicles. Peak period demand at Tunnel A exceeds 4,500 vehicles per hour, significantly greater than the typical maximum highway capacity simulated of 4,000 vehicles per hour.
Traffic was simulated for a nine-hour period, beginning one hour prior to the AM peak period and continuing until just prior to the expected start of the PM peak period. The one-hour of simulation prior to the AM peak period was used as a warm up period in order to fulfill the assumption that the road network would be populated when the simulation begins. Both the northbound and southbound tubes of the tunnel complex were simulated to be closed without warning due to flooding beginning at 7 AM as a result of the cyber-attack simulated. Identification and correction of the cause of flooding and restoration of traffic flow was simulated to require more time than available between morning and evening peak periods.
Simulation Testing
The tunnel scenario was simulated using Cube Avenue®, a mesoscopic traffic simulation. A mesoscopic simulation was selected for testing because it allowed assessing results in sufficient detail while allowing the high total number of vehicles over a regional network to be simulated in each run (over 1 million vehicle trips). Mesoscopic simulations model vehicles in packets with the number of vehicles included in each packet assigned by the user after considering the intended purpose. For these tests, 10 vehicles were included in each packet. The mesoscopic simulation allows dynamic loading of vehicles and better representation of peak period conditions. Figure 4 shows the rates of vehicle loading over the tested period.
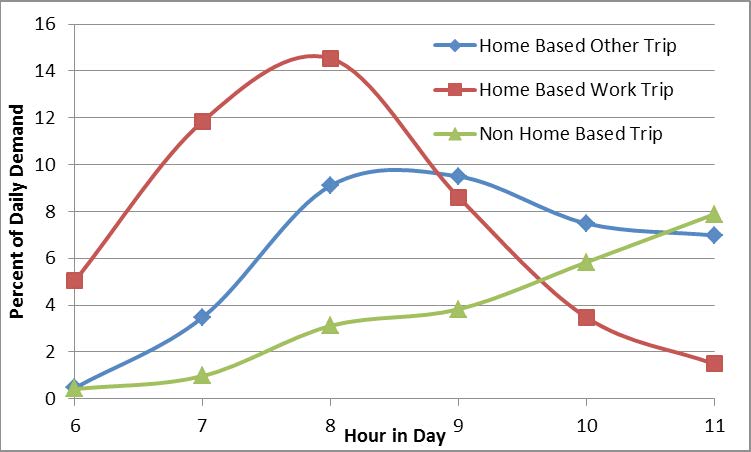
Figure 4. Demand Curves used for the Peak Period Mesoscopic Model
Simulations were initially run to establish and measure network conditions in a typical peak period. Each simulation run used to represent typical conditions were run for 10 iterations to approximate equilibrium conditions. Simulations were then run to simulate the hacked scenario with the network modified by closing the tunnel one hour into the simulation. This timing meant that some vehicles would have chosen their commute path prior to the closing and traveled far enough to prevent them from being able to adjust their route when congestion related to the closure became apparent. Simulations for the cyber-attack scenario were run for 7 iterations. Reducing the number of iterations allowed the simulation to appropriately model vehicles not having prior knowledge of the tunnel hacking. This resulted in the simulation allowing some vehicles to reroute because of the attack, but still model the confusion of vehicles attempting to travel across the tunnel without prior knowledge of the tunnel being shut down.
Intelligent Transportation Systems (ITS) could be used in a similar real world scenario to warn travelers or suggest alternate routes of the closure, but were not simulated in the scenario since most commuters would have begun travel or selected their routes prior to tunnel closure and ITS was unlikely to significantly reduce the severity of results. No accidents or incidents were simulated at any location. Metrics included in testing included:
- Total vehicle travel times for vehicles from the north to south
- Total vehicle travel times for all vehicles in region
- Total vehicle volumes across each major water crossing
- Queues remaining at the end of the simulation
Table 2 provides average results for the typical and hacked scenarios of vehicle packets with origins and destinations for trips that utilized Tunnel A during typical conditions. Table 3 provides total system averages of all packets in the system, not just packets that used the tunnel. Thirty simulation runs were made for each case, each with different random seed values. As can be seen in Table 2, the average travel time for the vehicle packets traveling over the tunnel increased from 54.5 minutes to 170.9 minutes because vehicles in the hacked case were forced to reroute resulting in congestion of the alternate crossings. This results in an increase of 214% in average travel time. Table 3 indicates that the average travel time of all vehicles traveling in the system increased from 19.4 minutes to 34.7 minutes (a 94% increase). In addition, the table 3 shows that the average speed of the vehicles traveling in the system decreased from 29.21 mph to 16.42 mph (a 44% decrease).
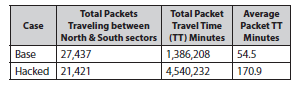
Table 2. Travel time results for just origin destination pairs that used the tunnel during the base scenario
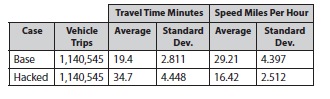
Table 3. System average speeds for base and hacked tunnel scenarios from 30 simulation runs with varying random seed values
Tunnel Consequence Analysis
As one might expect, most southbound traffic that would normally have used the Tunnel A diverted to Tunnel B when Tunnel A closed. Tunnel B is typically underutilized during all normal conditions, including the morning peak period. However, simulation tests showed that total vehicle volumes using the tunnel B remained under capacity during the AM peak period, even when traffic diverted from the tunnel with knowledge of the tunnel closing. This was due to vehicles that normally use the tunnel B having already cleared the crossing before the arrival of rerouted vehicles from the tunnel. The increase in vehicle volume significantly increased delays at already congested Southside bottlenecks.
The travel time for vehicles that would be expected to use other roadways in the region increased by 97%. Total delays at bottlenecks were so severe that they caused the average travel times for [all] regional commuters (not just those using affected routes) to nearly double from 19.4 to 34.7 minutes. Average travel times for commuters from the northern sector to the southern sector increased by 68%, from 54.5 to 170.9 minutes.
An additional analysis of traffic conditions at tunnel B and a river bridge in the region was conducted to assess what might happen during the PM peak period. In contrast to what was seen in the AM period, all commuters in the PM knew of the Tunnel A’s closure prior to starting their trips. We expected that this would lead to more vehicles reaching the crossings at the same time, causing congestion that would not normally be present. As forecast, the additional traffic leaving the southside caused already severe congestion for westbound travelers. Traffic volumes were higher than with Tunnel B’s availability, but remained below capacity with no queuing. This was due to the extensive congestion at other bottlenecks slowing the rate at which vehicles reached the Tunnel B.
Results
The simulation runs performed used traffic volumes consistent with a typical weekday. Congestion increases during the summer tourist season with more than 30 thousand vacationers traveling to Southside and thousands of others traveling through the region. Greater travel time delays might occur if a cyber attack happened during the peak summer tourist season. Accidents and incidents were not considered in the study. Commuters in any major urban area know how dramatically such events can increase travel. Because the simulation runs did not take this into account, the travel time delays may be conservative.
The impact of ITS variable message signs, radio traffic reports, and traffic information systems components were not simulated. Use of these systems to direct commuters to viable paths might have reduced some travel times. However, as seen in a test scenario with Tunnel A closed, increasing the number of commuters who arrive at network choke points such as all water crossings at the same time may actually exacerbate the congestion problem and have an effect in direct opposition to that desired.
The tunnel scenario caused an increase in total regional travel time of 276,116 hours. Considering only the hourly delay and assigning an average time value of $25 per hour provides an estimated cost of over $6.9 million. The risk of this scenario in terms of regional travel time and cost is assessed as the likelihood of the scenario resulting in tunnel damage times the increase in regional travel time exceeded 100,000 hours and $3 million, not including tunnel damage costs.
Risk Avoidance and Mitigation
There are many ways to mitigate this attack at very low cost. At the beginning of our paper we stated that an important goal was awareness. ICS engineers must know that simply not being connected to the Internet does not mean ones ICS is inoculated from cyber exploitations such as the one presented in this paper. One low cost mitigation solution would be to place a computer offline to test USB drives for viruses or malware before putting them on machines to run patches. Another mitigation strategy would be to adopt formal procedures for how updates are applied as well as policies on procurement of USB drives. For instance, free USB drives from conferences are a known source of malware and honeypots.
Conclusion
This paper describes a modeled scenario to understand the risk from willful intrusion into ICS regarding the tunnel. The cost impact is much less than kinetic attacks on the tunnel itself. However, the risk is still considerable at an expected value of 105,878 hours in regional travel time increase and $2,645,839. Also, we did not consider the societal risk perception impact as it was beyond our scope. The consequences of a tunnel cyber-attack scenario caused an increase in total regional travel time of 276,116 hours and an estimated cost of $6.9 million.
Despite known vulnerabilities to ICS, many critical infrastructure owners and operators have not taken the steps to adequately protect their ICSs. The scenario and simulated results show that physical separation of ICS and office communication networks is not sufficient cyber protection. The tunnel scenario shows how unintentional human interaction with ICS and lack of understanding of the types of control system attack vectors available to adversaries remain vulnerable to external penetration or internal threats. The reality is most networks are connected at numerous uncontrolled points through simple things like roaming notebooks and back-up data servers. Gaining access to a relatively unprotected network would be enough to allow an attacker to gain full control of the ICS in less than an hour, sometimes in minutes.
References
- Wilshusen, G. (2012). Threats Impacting the Nation, Testimony Before the Subcommittee on Oversight, Investigations, and Management, Committee on Homeland Security, House of Representatives, U.S. Government Accounting Office, Washington D.C.
- Weiss, J. (2010). Protecting Industrial Control Systems from Electronic Threats, Momentum Press, NY.
- Boyer, S. (1999). SCADA Supervisory Control and Data Acquisition – 2nd Edition, Instrumentation, Systems, and Automation Society, Research Triangle Park, NC.
- Weiss, J. (2007). Threats Impacting the Nation, Testimony Before the Subcommittee on Oversight, Investigations, and Management, Committee on Homeland Security, House of Representatives, U.S. Government Accounting Office, Washington D.C.
- Kaplan, S. and Garrick, B. (1981). On the Quantitative Definition of Risk, Risk Analysis, Vol. 1, No. 1, pp.11-27.
- DHS Risk Lexicon (2010). Risk Steering Committee, p.27.
- Ezell, B., Bennett, S., Von Winterfeldt, D., Sokolowki, J., and Collins, A. (2010). Probabilistic Risk Analysis and Terrorism Risk, Risk Analysis, Vol. 30, No. 4, pp. 575-589.